使用Python核或R核
Jupyter notebook 是一个开源网络应用程序,它可以创造和共享文件中包含可运行的代码、数学方程式,可视化和叙事文本。 该应用程序包括数据清理和转换、数字模拟、统计模型、数据可视化、机器学习和其他更多功能。
The Jupyter system supports over 100 programming languages (called “kernels” in the Jupyter ecosystem) including Python, Java, R, Julia, Matlab, Scala, and many more. You can learn these “kernels” in the Jupyter-kernels repository in GitHub (https://github.com/jupyter/jupyter/wiki/Jupyter-kernels).
R语言
R是一个解释性编程语言编写,主要针对统计计算和图形,在统计人员和数据挖掘者中广泛用于数据分析和统计软件的开发。
There are several ways to set up Jupyter Notebook for R. We will learn two straightforward ways as follows:
使用Python核
这种方式允许在同一个Jupyter notebook中运行R和Python。
(1)安装要求
- Has Python installed in version 3.5 or higher
- 安装Anaconda,或
- 安装传统的Python
- Has R installed in version 3.2 or higher
- Has Jupyter Notebook installed
(2)两种方式来安装R
The first way is to go to R web to download R installer to install it if have classical Python installed on your system. If you have Anaconda Python, you can install R by Conda as follows:
conda install -c r r-essentials
(3)安装Jupyter Notebook
Installing Jupyter notebook by:
pip install notebook
或者通过Anaconda来安装:
conda install notebook
(4)安装rpy2库
- 安装Numpy
pip install numpy - 安装Pandas
pip install pandas - 安装rpy2库
pip install rpy2或
conda install rpy2
After installing rpy2, we need to enable the %%R 魔术函数。
%load_ext rpy2.ipython
We only need to run it once for the first time. After these installations, the Jupyter Notebook now supports both Python 3 and R programming languages
(3)安装R包
We can install R packages directly in the Jupyter notebook. For example, we install ‘ggplot2’ by the following command:
%%R
安装。包('ggplot2')
然后会请你选择一个CRAN镜使用的,你只是选择离你最近的CRAN镜。
We can also name a CRAN mirror for use in the command directly. For example, let’s choose ‘http://cran.us.r-project.org’, then we can type the following code to run:
%%R
安装。包('ggplot2',repos='http://cran.us.r-project.org', quiet=TRUE)
成功安装后,我们可以装载的包装使用以下命令:
%%R
库(ggplot2)
让我们看看一个具体的例子,在以下部分。
(4)实例
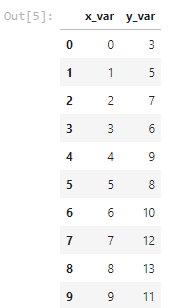
In this example, we will import Python Pandas and NumPy libraries and create a pandas DataFrame.
进口 大熊猫 作为 pd

df = pd.据框({
 'x_var': [0, 1, 2, 3, 4, 5, 6, 7, 8, 9],
 'y_var': [3, 5, 7, 6, 9, 8, 10, 12, 13, 11]
})df运行后,上述代码,我们得到的东西:

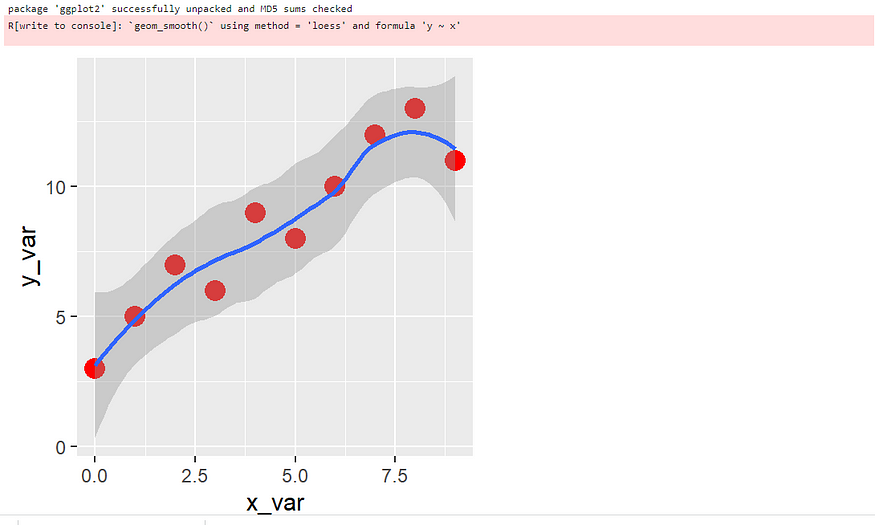
So far, it is pure Python code. Next, we use R to make a plot using “ggplot2′ for the above data table, for example.
%%R -我df -w3 -h3 --单位 -r200安装。包('ggplot2',repos='http://cran.us.r-project.org', quiet=TRUE)库(ggplot2)
ggplot(数据 = df,aes(x = x_var,y = y_var)) +
geom_point(颜色 = "红色",尺寸 = 4) +
stat_smooth()在第一线,我们呼R使用'%%R'神奇的,
- 我 是为了"输入"
- df 是熊猫据框
- -w-h 定义图大小,3通过3英寸,在这个例子
— 单位 –r 定义大小的单位在决议,说200dpi决议在这个例子。 单元可以改变的要素,厘米,等等
所以第一线可以被描述为 "我们通过数据df作为输入,R,然后让默认图3通过3英寸200dpi决议。"
接下来的两个线的安装软件包"ggplot2",这是我们已经学会在前一部分。 这里只是告诉你如何做到这一点,在一个码段。 以下行为负荷包,我们也是清楚的。 最后的几条线做一个情节使用"ggplot2". 输出如下图所示。

使用R核
(1)安装Jupyter notebook的R核
IRkernel 可以通过R官网安装包安装:
%%R
install.packages('IRkernel')
(2)使Jupyter notebook能使用它
IRkernel::installspec() 将安装一个内核"ir"和"使R"名称能显示在Jupyetr中。
默认情况下,其为系统的每用户都安装此核。 可以installspec命令设置用户False 。
%%R
IRkernel::installspec(user = FALSE) #在当前安装的R中注册此核
(3)创建R Jupyter notebook
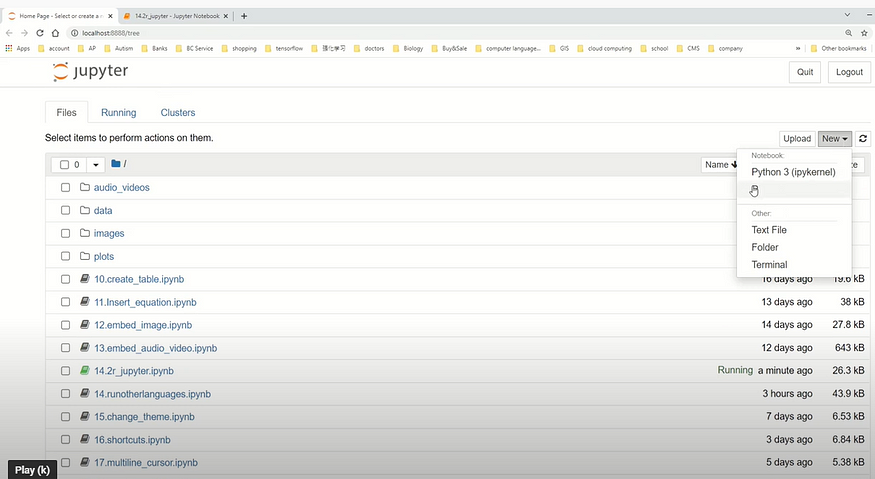
创建一个新的notebook,选择R核,如下图所示。

然后,复制以下代码的到notebook单元中。
n <- floor(rnorm(10000, mean = 200,sd = 50))
t <- table(n)
barplot(t)
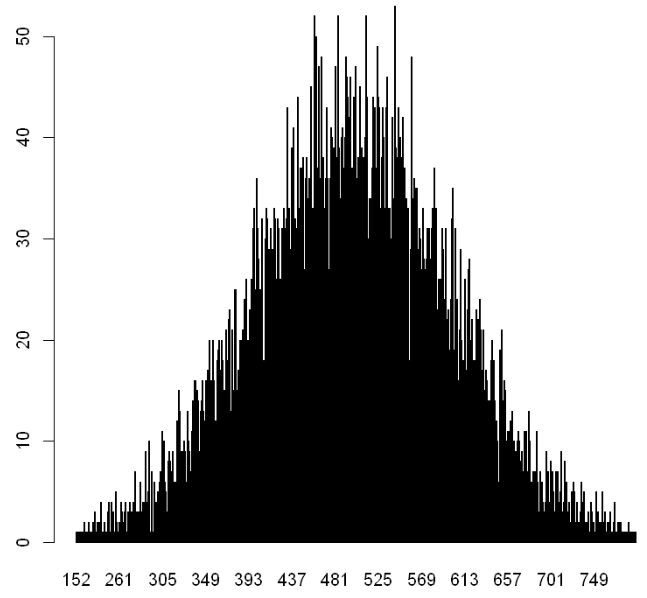
运行jupyter notebook,你会看到如下结果:

结论
In this article, two methods of running R in Jupyter notebook. One method is to install Python rpy2 library, and another method is to install R kernel for Jupyter Notebook. The differences between these methods are that we can run Python code and R in the same Jupyter notebook for the first methods, while we can only run R code in a separate Jupyter notebook for the second method.
此外,您可以看一段视频版本的本文件如下。 请订阅更多的技巧,通过点击: https://www.youtube.com/channel/UCQpUJn9GfUjKkFP2X-1pjoQ?sub_confirmation=1
If you are interested in learning Jupyter notebook systematically, welcome to my following tutorial and online course:
(1) 22个Jupyter notebook的便捷性: https://www.youtube.com/watch?v=xEI3065M-3g&t=3s
(2) 实用Jupyter notebook从初级到专家: https://academy.deepsim.xyz/courses/practical-jupyter-notebook-from-beginner-to-expert/
