Filters method is an efficient way to implement Discrete Wavelet Transform
1. What is a Filter Bank
Filter banks play an important role in modern signal and image processing. As its name suggests, a Filter Bank is a bank of filters, meaning a collection of filters, or many filters in simple words, and each of the filter is applied to the original signal. So, one signals can be decomposed into 2 or more signals out. Then what is a Filter bank?
Simply speaking, a Filter Bank can be defined as a system (an array) of bandpass filters that split the input signal (St) into a set of analysis signals (x1t, x2t, …, xnt ) and each one carrying a single frequency sub-band of the original signal.
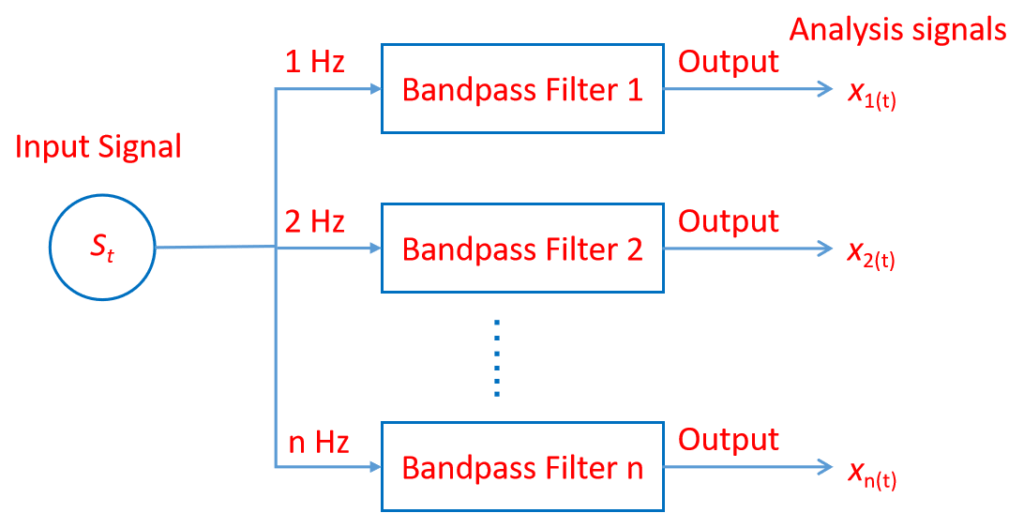
In wavelet analysis, filter banks usually refers to a class of systems that generates scaling and wavelet function. The below figure shows the simple structure of a filter bank can be illustrated by the figure below.
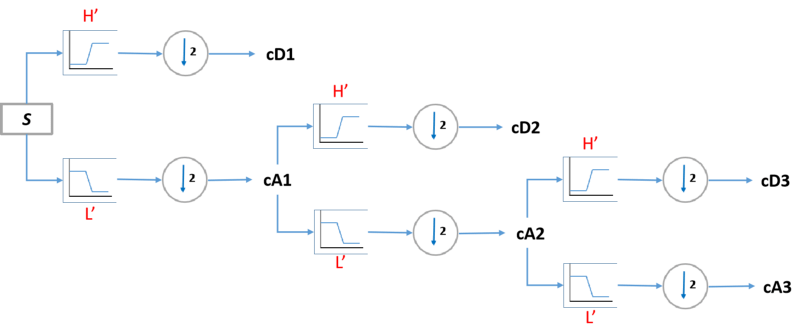
In practice, an efficient way to implement Discrete Wavelet Transform (DWT) is to use filters method, which was developed in 1988 by Mallat. This very practical filtering algorithm yields a Fast Discrete Wavelet Transform (FWT).
2. Wavelet filters coefficients
Wavelet filters coefficients are the most important information used in Discrete Wavelet Transforms (DWT). In the PyWavelets library of Python, filters coefficients can be obtained via the dec_lo, dec_hi, rec_lo and rec_hi attributes, which correspond to lowpass and highpass decomposition filters and lowpass and highpass reconstruction filters respectively.
In a previous article, we have already learned what PyWavelets is, how to install it, and how to display its built-in Wavelets families and their members in PyWavelets, and so on. In the PyWavelets, the filter_bankmethod returns a list for the current wavelet in the following order: [dec_lo, dec_hi, rec_lo, rec_hi].
dec_lo: Decomposition low-pass filterdec_hi: Decomposition high-pass filterrec_lo: Reconstruction low-pass filterrec_hi: Reconstruction high-pass filter
3. Print Filter Bank of a Discrete Wavelet
First, let’s import the required packages: one is PyWavelets and another is matplotlib for visualization.
# import required packages
import pywt
import matplotlib.pyplot as plt
Next, we define a discrete wavelt, for example, “db5” , and then display its filter bank as follows:
wavelet = pywt.Wavelet('db5')
wavelet.filter_bank
The output is as follows:
([0.0033357252854737712,
  -0.012580751999081999,
  -0.006241490212798274,
  0.07757149384004572,
  -0.032244869584638375,
  -0.24229488706638203,
  0.13842814590132074,
  0.7243085284377729,
  0.6038292697971896,
  0.16010239797419293],
 [-0.16010239797419293,
  0.6038292697971896,
  -0.7243085284377729,
  0.13842814590132074,
  0.24229488706638203,
  -0.032244869584638375,
  -0.07757149384004572,
  -0.006241490212798274,
  0.012580751999081999,
  0.0033357252854737712],
 [0.16010239797419293,
  0.6038292697971896,
  0.7243085284377729,
  0.13842814590132074,
  -0.24229488706638203,
  -0.032244869584638375,
  0.07757149384004572,
  -0.006241490212798274,
  -0.012580751999081999,
  0.0033357252854737712],
 [0.0033357252854737712,
  0.012580751999081999,
  -0.006241490212798274,
  -0.07757149384004572,
  -0.032244869584638375,
  0.24229488706638203,
  0.13842814590132074,
  -0.7243085284377729,
  0.6038292697971896,
  -0.16010239797419293])
We can just print one filter, for example, the decomposition low-pass filter using the following code:
wavelet.dec_loWe get the following results:
[0.0033357252854737712,
 -0.012580751999081999,
 -0.006241490212798274,
 0.07757149384004572,
 -0.032244869584638375,
 -0.24229488706638203,
 0.13842814590132074,
 0.7243085284377729,
 0.6038292697971896,
 0.16010239797419293]
5. Visualization of Wavelet Bank
First, let’s obtain the list of the four filters using the following methods:
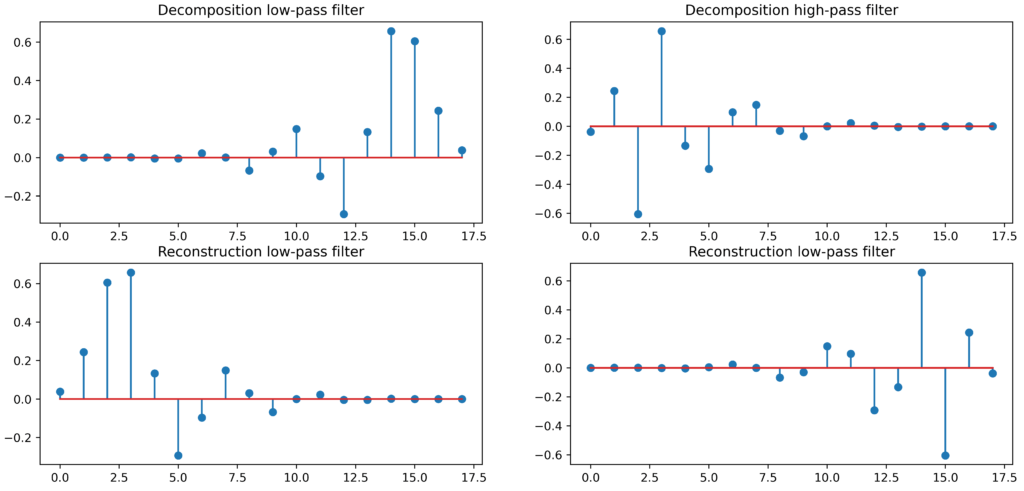
[dec_lo, dec_hi, rec_lo, rec_hi] = wavelet.filter_bankThen, we can use Matplotlib to make a stem plot for each filter.
fig, ((ax1, ax2), (ax3, ax4)) = plt.subplots(2, 2, figsize=(15,7))

ax1.stem(dec_lo)
ax1.set_title('Decomposition low-pass filter')
ax2.stem(dec_hi)
ax2.set_title('Decomposition high-pass filter')
ax3.stem(rec_lo)
ax3.set_title('Reconstruction low-pass filter')
ax4.stem(rec_hi)
ax4.set_title('Reconstruction high-pass filter')

plt.savefig('./results/filter_bank.png') # save it in any path, here I save it into the results folder in the working directory
plt.show()
The output looks as follows:
6. Online Course
If you are interested in learning Practical Wavelet Transforms from very beginning, welcome to the courses via the following linage: