– with Python Kernel or R Kernel
Jupyter notebook is an open-source web application, where one can create and share documents that contain live code, math equations, visualizations and narrative text. The applications include data cleaning and transformation, numerical simulation, statistical modelling, data visualization, machine learning, and much more.
The Jupyter system supports over 100 programming languages (called “kernels” in the Jupyter ecosystem) including Python, Java, R, Julia, Matlab, Scala, and many more. You can learn these “kernels” in the Jupyter-kernels repository in GitHub (https://github.com/jupyter/jupyter/wiki/Jupyter-kernels).
R Language
R is an interpreted programming language for statistical computing and graphics, which is widely used among statisticians and data miners for developing statistical software and data analysis.
There are several ways to set up Jupyter Notebook for R. We will learn two straightforward ways as follows:
Use Python Kernel
This way allows us to run R and Python together in the same notebook.
(1) Installation Requirements
- Has Python installed in version 3.5 or higher
- Install Anaconda, or
- Install traditional Python
- Has R installed in version 3.2 or higher
- Has Jupyter Notebook installed
(2) Two Ways to Install R
The first way is to go to R web to download R installer to install it if have classical Python installed on your system. If you have Anaconda Python, you can install R by Conda as follows:
conda install -c r r-essentials
(3) Install Jupyter Notebook
Installing Jupyter notebook by:
pip install notebook
or install it using conda for Anaconda installer:
conda install notebook
(4) Install rpy2 library
- install numpy
pip install numpy - install pandas
pip install pandas - install rpy2 library
pip install rpy2or
conda install rpy2
After installing rpy2, we need to enable the %%R magic.
%load_ext rpy2.ipython
We only need to run it once for the first time. After these installations, the Jupyter Notebook now supports both Python 3 and R programming languages
(3) Install R packages
We can install R packages directly in the Jupyter notebook. For example, we install ‘ggplot2’ by the following command:
%%R
install.packages('ggplot2')
Then it will ask you to select a CRAN mirror for use, you just select your nearest CRAN mirror.
We can also name a CRAN mirror for use in the command directly. For example, let’s choose ‘http://cran.us.r-project.org’, then we can type the following code to run:
%%R
install.packages('ggplot2',repos='http://cran.us.r-project.org', quiet=TRUE)
After successful installation, we can load the package using the following command:
%%R
library(ggplot2)
Let’s see a concrete example in the following section.
(4) Example
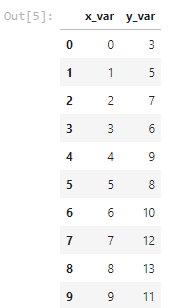
In this example, we will import Python Pandas and NumPy libraries and create a pandas DataFrame.
import pandas as pd

df = pd.DataFrame({
    'x_var': [0, 1, 2, 3, 4, 5, 6, 7, 8, 9],
    'y_var': [3, 5, 7, 6, 9, 8, 10, 12, 13, 11]
})dfAfter running the above code, we get something as:
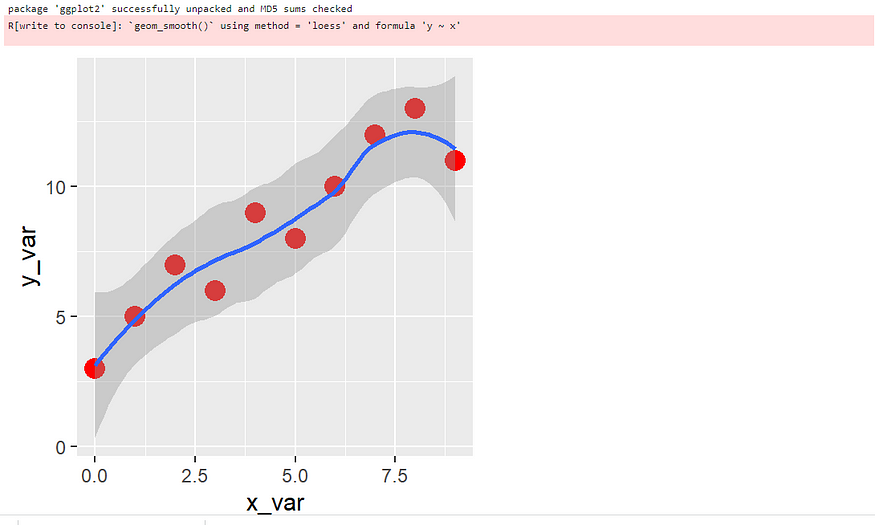
So far, it is pure Python code. Next, we use R to make a plot using “ggplot2′ for the above data table, for example.
%%R -i df -w 3 -h 3 --units in -r 200install.packages('ggplot2',repos='http://cran.us.r-project.org', quiet=TRUE)library(ggplot2)
ggplot(data = df, aes(x = x_var, y = y_var)) +
geom_point(color = 'red', size = 4) +
stat_smooth()In the first line, we call R using ‘%%R’ magic, where
- i is for “input”
- df is the Pandas dataframe
- -w and -h define figure size, 3 by 3 inches in this example
— units in –r define size unit in resolution, say 200 dpi resolution in this example. Unit can be changed to px, cm, etc
So the first line can be described as “We pass data df as input to R, and then make default figure size 3 by 3 inches with 200 dpi resolution.”
The next two lines is to install package “ggplot2”, which we have already learnt in previous section. Here just show you how to do this in one code snippet. The following line is to load the package, which we are also clear. The last few lines to make a plot using “ggplot2”. The output looks like the following screenshot.
Use R kernel
(1) Install R kernel for Jupyter Notebook
IRkernel can be installed via the Comprehensive R Archive Network [CRAN].
%%R
install.packages('IRkernel')
(2) Making the kernel available to Jupyter
IRkernel::installspec() will install a kernel with the name “ir” and a display name of “R”.
By default, it installs the kernel per-user. To install system-wide, set user to False in the installspec command:
%%R
IRkernel::installspec(user = FALSE) # to register the kernel in the current R installation
(3) Create R Jupyter Notebook
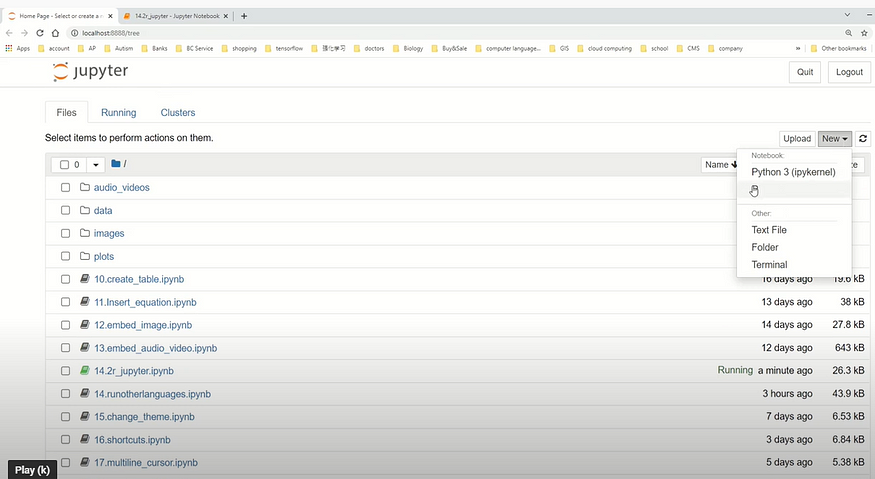
Create a new notebook and select R kernel as follows.
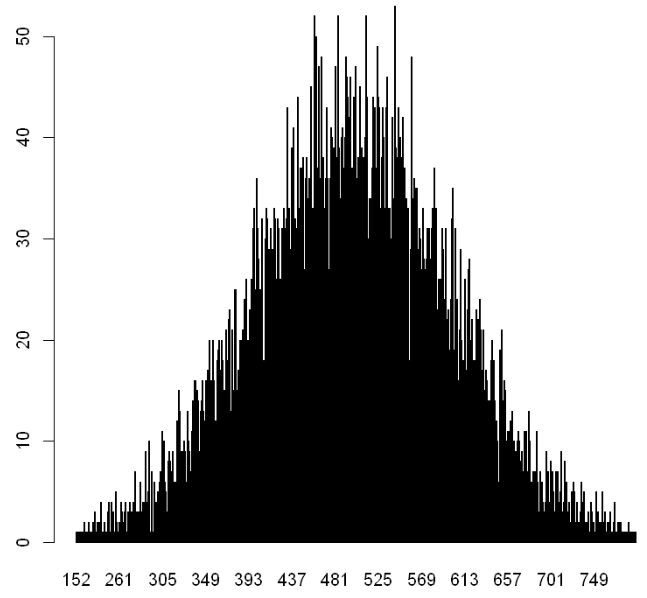
Then copy the following code in the cell.
n <- floor(rnorm(10000, mean = 200, sd = 50))
t <- table(n)
barplot(t)
Run jupyter notebook, you will see the following outcome in Jupyter notebook.
Conclusion
In this article, two methods of running R in Jupyter notebook. One method is to install Python rpy2 library, and another method is to install R kernel for Jupyter Notebook. The differences between these methods are that we can run Python code and R in the same Jupyter notebook for the first methods, while we can only run R code in a separate Jupyter notebook for the second method.
Besides, you can watch a video version of this paper as follows. Please subscribe for more tips by click: https://www.youtube.com/channel/UCQpUJn9GfUjKkFP2X-1pjoQ?sub_confirmation=1
If you are interested in learning Jupyter notebook systematically, welcome to my following tutorial and online course:
(1) 22 Pretty Handy Features of Jupyter Notebook: https://www.youtube.com/watch?v=xEI3065M-3g&t=3s
(2) Practical Jupyter Notebook from Beginner to Expert: https://academy.deepsim.xyz/courses/practical-jupyter-notebook-from-beginner-to-expert/